

 Munich Security Conference
  China's Population Decline and Robots
  Israel disregards the law.
  The US Department of Homeland Security has begun a partial shutdown.
  Violent Anti-Government Protests in Tirana
  China Showcases AI-Driven Healthcare Innovations at World Health Expo Dubai
  US Military Strikes Suspected Drug Boat in Pacific, Two Killed
  North Korea’s Kim Jong Un Says Military’s Fighting Front Will Expand
  Ambulance Helicopter Crashes at Military Base in Libya
  Two Residential Buildings Collapse in Lebanon’s Tripoli, At Least Six Dead
Turkish Defense Industry Land Forces
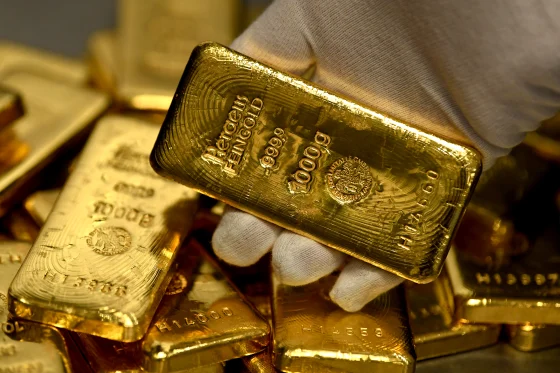
Gold by the Ounce: A 50-Year Story of Wealth, Risk and Global Markets
Gold — measured in troy ounces — remains one of the most watched financial assets in the world. From safe-haven demand in turbulent times to long-term wealth preservation, the price of gold reflects economic trends, geopolitical risk and investor psychology. This comprehensive analysis traces the evolution of gold prices over five decades, explains current levels, and explores why gold matters more than ever in the modern global economy.
Current Gold Price Snapshot
As of early February 2026, the spot price for gold is trading at around $4,950 per troy ounce — a dramatic rise compared to historical norms. These figures represent active price discovery in global markets, influenced by currency dynamics, central bank policy, and safe-haven flows during times of uncertainty. :contentReference[oaicite:0]{index=0}
This level places gold among the most valuable commodity prices ever recorded in U.S. dollar terms, far exceeding previous benchmarks. Recent forecasts from major financial institutions suggest continued volatility and an upward bias, with some models projecting prices above $6,000 per ounce by late 2026. :contentReference[oaicite:1]{index=1}
Why Gold Still Matters
Gold is unique among financial assets because it has no counterparty risk, no coupon or dividend, and no issuer that can default. It has been used as a store of value for thousands of years and remains deeply embedded in both cultural and economic systems. Investors turn to gold for several key reasons:
- Inflation hedge: Gold often preserves purchasing power when fiat currencies weaken.
- Safe haven: During geopolitical tensions or financial stress, gold demand typically rises.
- Diversification: Gold’s historical returns often move independently from stocks and bonds.
Gold’s role as a strategic asset was visible in recent years, especially as central banks continued buying bullion and as uncertainty in markets increased. :contentReference[oaicite:2]{index=2}
A 50-Year Historical Journey
The last half-century has been the most transformative era in gold markets since the metal was unshackled from fixed exchange rates after the collapse of the Bretton Woods system in the early 1970s.
Data shows that in the early 1970s, gold traded near $35 per ounce. Today, with prices around $4,800–$5,000 per ounce, gold has increased more than **13,000 %** over roughly 54 years, one of the most dramatic long-term moves in financial history. :contentReference[oaicite:3]{index=3}
This long-term rise was not smooth:
50-Year Gold Price Timeline: Year-by-Year Analysis (1975–2026)
Annual Gold Price Table (USD per troy ounce)
| Year | Approx. Gold Price (USD/oz) | Market Context |
|---|---|---|
| 1980 | ~$615 | Inflation shock, oil crisis, geopolitical instability |
| 2000 | ~$279 | Equity-driven markets, strong dollar era |
| 2008 | ~$872 | Global financial crisis, banking system stress |
| 2011 | ~$1,573 | Eurozone debt crisis, monetary expansion |
| 2020 | ~$1,773 | Pandemic shock, global stimulus |
| 2023 | ~$1,936 | Persistent inflation, central-bank buying |
| 2024 | ~$2,386 | Safe-haven flows, declining real yields |
| 2025 | ~$3,400–$3,600 | Structural breakout, reserve diversification |
| 2026 | ~$4,900–$5,500 | Historic highs, systemic trust shift |
Year-by-Year Interpretation
1980 stands as the benchmark year for inflation-driven gold rallies. The surge reflected a loss of confidence in monetary stability rather than speculative enthusiasm alone.
2000 illustrates gold’s weakest phase in modern history, when capital overwhelmingly favoured equities and growth assets, pushing gold to long-term lows.
2008 marked gold’s return as a crisis asset. Unlike equities, gold preserved value during systemic financial stress.
2011 represented the peak of post-crisis monetary anxiety, with sovereign debt fears driving gold to record levels for that decade.
2020 redefined gold’s role in pandemic-era economics, as unprecedented stimulus measures reduced the opportunity cost of holding non-yielding assets.
2023–2024 showed that gold’s strength was no longer purely crisis-driven but increasingly structural, supported by central-bank accumulation and persistent geopolitical risk.
2025 signaled a regime shift. Gold moved decisively above previous valuation ranges, suggesting that markets were pricing long-term monetary uncertainty rather than temporary shocks.
2026 has pushed gold into uncharted territory. Prices near or above $5,000 per ounce indicate a broader reassessment of currency trust, global reserves, and financial system resilience.
Interactive 50-Year Gold Price Chart
The interactive chart below allows readers to explore gold’s price evolution over the past five decades, highlighting both long-term trends and periods of extreme volatility.
This interactive visualization reinforces the article’s core argument: gold’s long-term trajectory reflects shifts in monetary regimes, investor trust, and global risk perception rather than short-term speculation alone.
According to historical datasets, gold’s long-term growth reflects expanding global liquidity, monetary policy responses, and sustained safe-haven demand. :contentReference[oaicite:5]{index=5}
Drivers Behind the Long-Term Rise
Several structural factors explain why gold has appreciated over the long run:
Monetary Policy and Liquidity
Central bank interventions, especially after the global financial crisis, pushed liquidity into markets and weakened real yields — often making gold more attractive compared to cash or bonds.
Inflation and Debt Concerns
Periods of elevated inflation and concerns about sovereign debt have historically correlated with higher gold demand, as investors seek alternatives to depreciating currencies.
Geopolitical Risk and Safe Havens
Wars, tensions between major powers, and economic sanctions have all driven portions of capital toward gold as a non-credit, non-sovereign form of wealth storage.
Central Bank Buying
In recent years, central banks — particularly in emerging markets — have been net buyers of gold reserves to diversify their holdings away from a single currency. This structural demand supports higher long-term prices. :contentReference[oaicite:6]{index=6}
Gold in 2025–2026: Historic Rally and Forecasts
The year 2025 saw gold make historic moves, with prices reaching new all-time highs and averaging significantly above long-term norms. Analysts attributed this to a mix of geopolitical risk, broad monetary loosening, and demand from institutional buyers. :contentReference[oaicite:7]{index=7}
Forecasts for 2026 remain divergent: some models suggest continued upward pressure near $6,000–$6,300 per ounce, while others caution that volatility could produce sharp short-term corrections. :contentReference[oaicite:8]{index=8}
Gold’s Future Role in Portfolios
While past performance does not guarantee future returns, gold’s historical resilience and strategic utility suggest it will remain a key component of diversified portfolios. Its sensitivity to real yields, inflation expectations, and risk sentiment means that gold will likely continue to reflect broader macroeconomic trends.
Investors should be aware that gold’s price can move sharply in both directions — and as with all assets, risk management is essential.
Conclusion
Gold’s half-century evolution tells a story of monetary change, investor psychology, and shifting global power dynamics. From a fixed-price relic to a dynamic market benchmark, gold remains one of the most important indicators of financial health and market sentiment in the global economy.